Sharing your data has never been easier
As an instrument operator, do you wish that there was a better way of sending your sample results to clients and students than using spreadsheets or .PDFs?
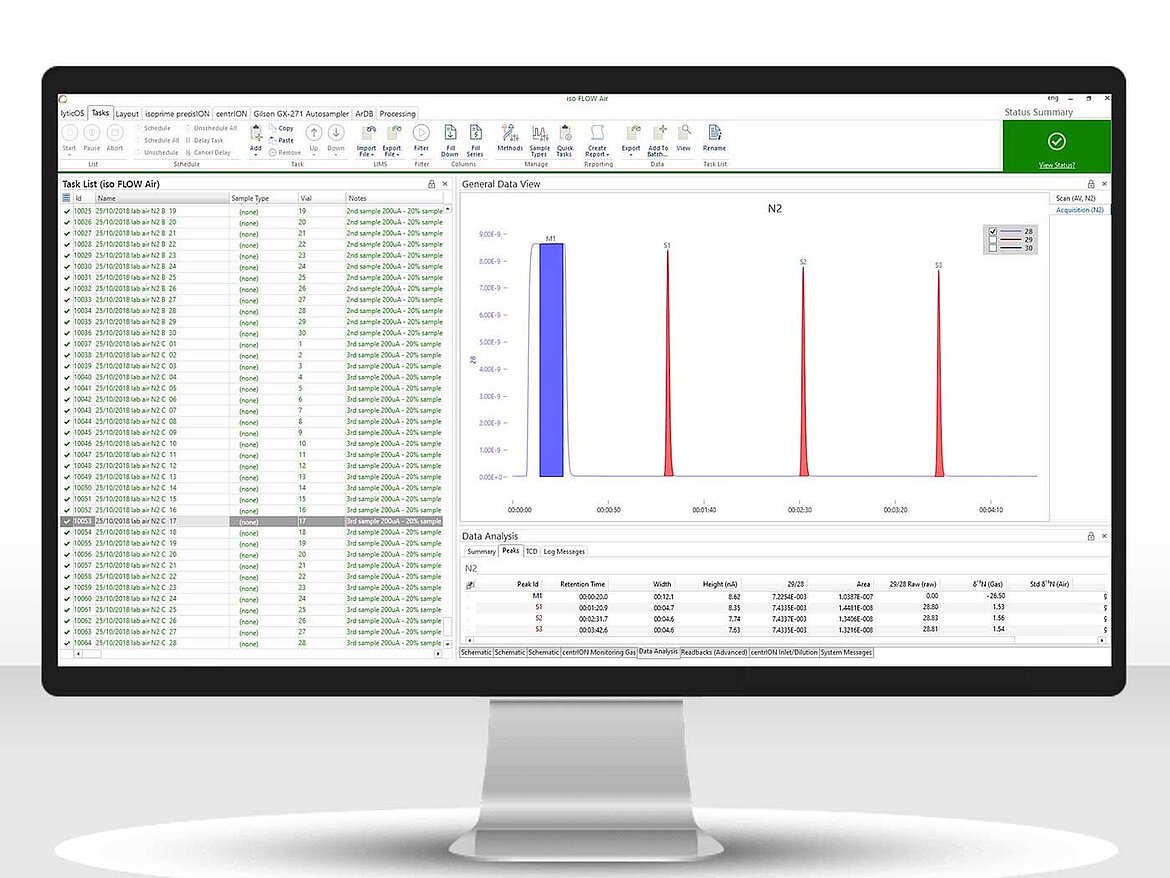
As the person receiving sample results back from the lab, perhaps you wish that you could see how a peak was integrated, or how a baseline was calculated?
Using lyticOS® Data Viewer, processed data can now be easily shared with others for them to interrogate, but not edit or re-process. This allows your students, clients or colleagues receiving the data to better see their analytical results alongside interactive peak display for clear evaluation.
By sharing your processed data as a lyticOS ".larc" file, people receiving your data will be able to download our free Data Viewer and open the processed results complete with calibration, statistics and any other corrections applied giving them a complete view of their sample results.
Download the lyticOS Data Viewer for free
Have you been sent a lyticOS "*.larc" file containing your data? Then download and install the free lyticOS Data Viewer now to be able to see your data!
How to download the Data Viewer for free
Watch the video to learn how to download and create a license in our secure portal for your copy of lyticOS Data Viewer.

The future of analytics: lyticOS Software Suite
Not heard about lyticOS Software Suite yet? It is our vision for the future of our market-leading range of analyzers built upon more than 100 years of experience in analytical instrumentation. lyticOS Software Suite is the result of a deep and productive collaboration between our customers and developers to create a feature-rich platform with modern user interface able to provide new capabilities and evolve with our global customer base. With lyticOS Software Suite, we are ready to help you and your laboratory face the future.
lyticOS Data Viewer features
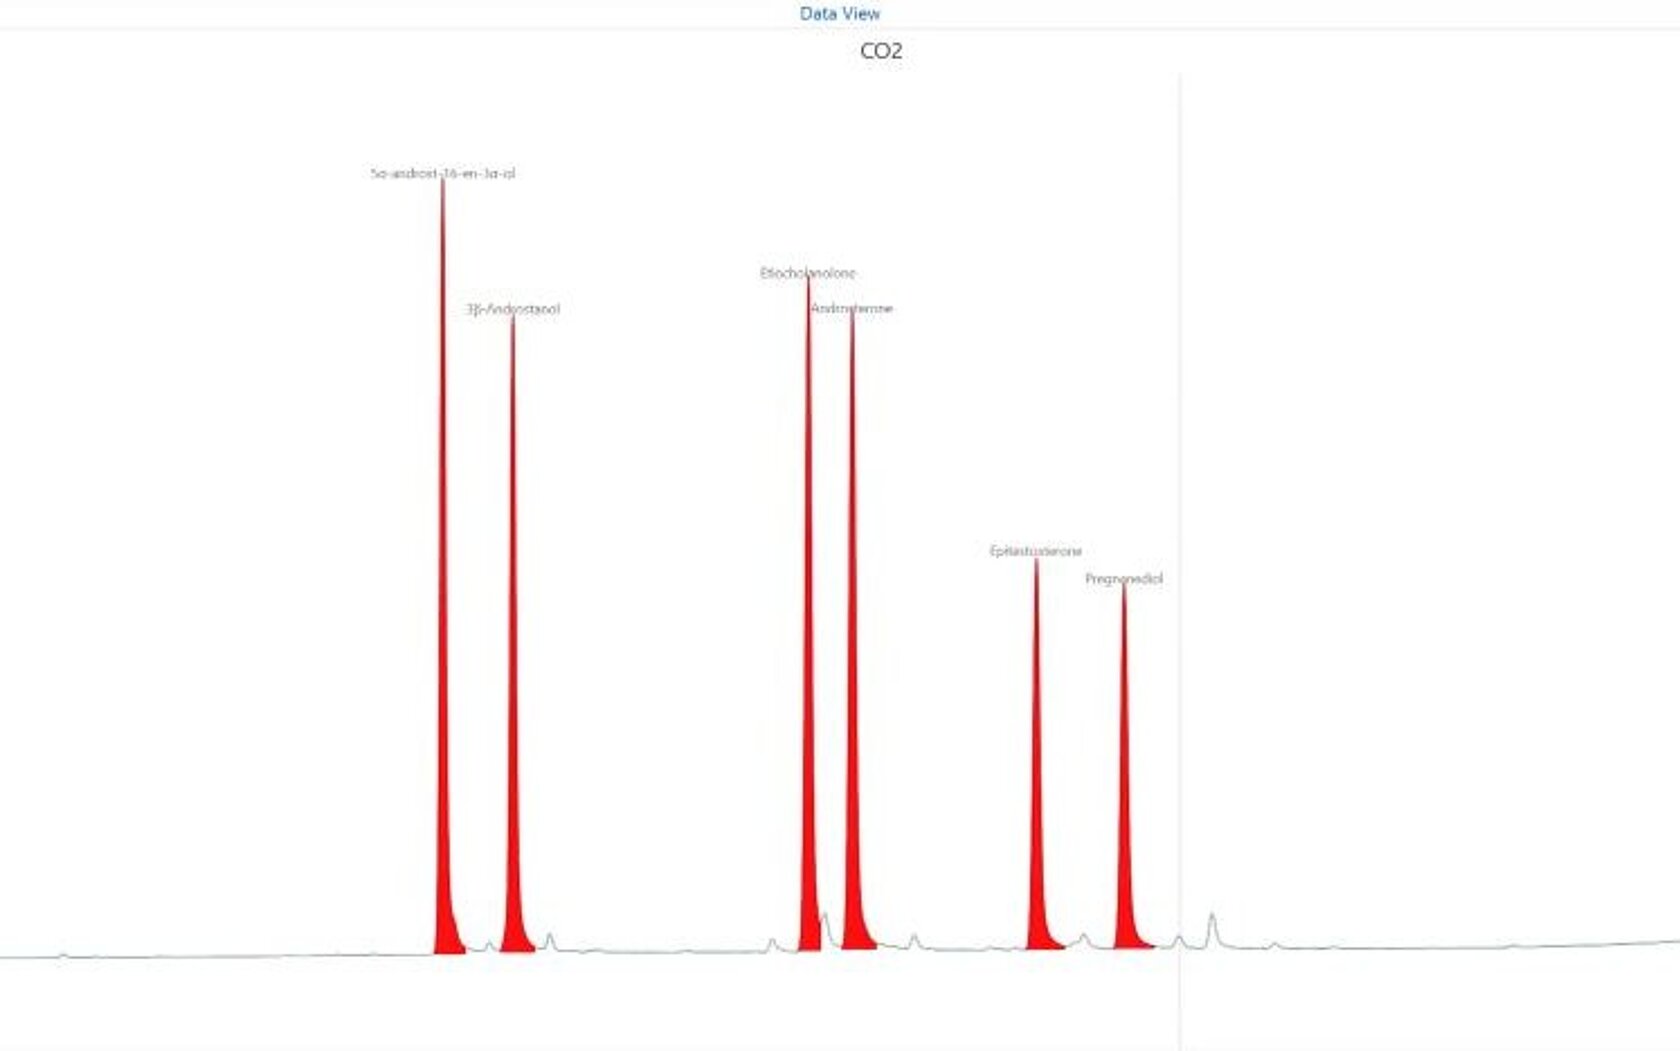
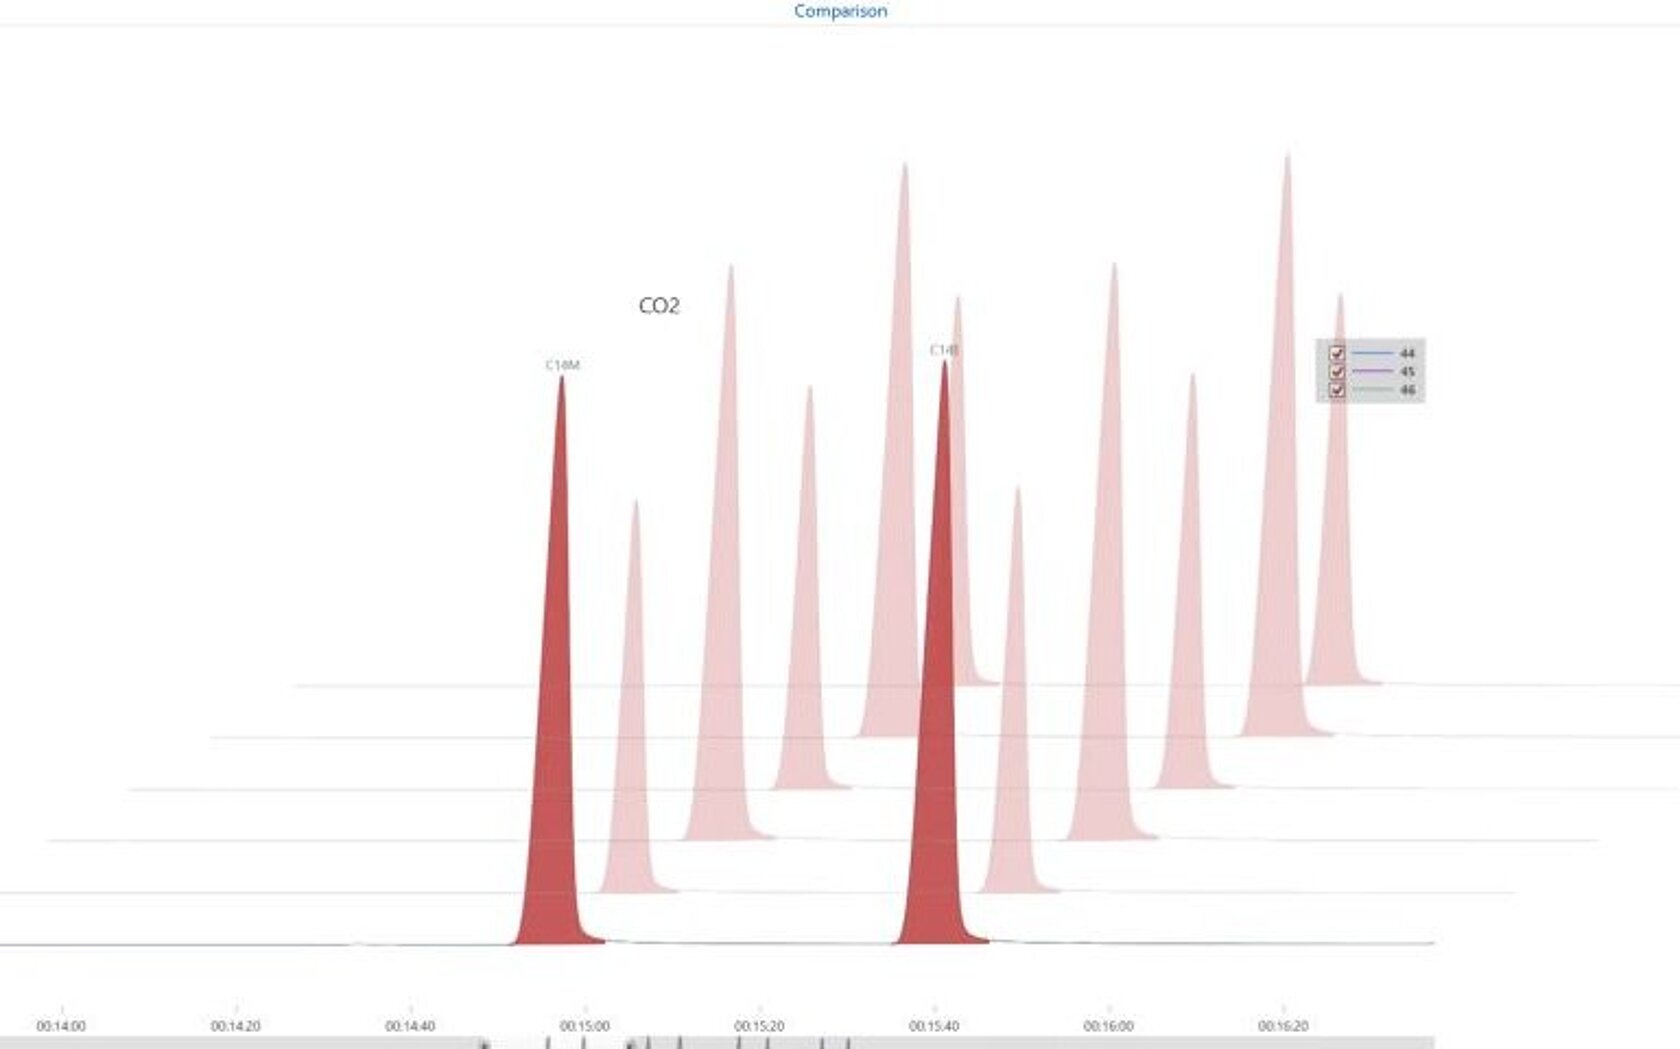
3D Peak display
The 3D peak display allows multiple sample peak displays to be overlayed, staggered and manipulated to make it simple to evaluate peak shape integrity over many analyses.
Peak comments
When looking at sample peak displays you often discover interesting phenomena or areas of concern. With our new peak comments feature, you can add comments and shapes anchored to the peak display so you can record your thoughts directly in the peak display and share with others.