We recently celebrated the 25th anniversary of 'Isotope Tracers in Catchment Hydrology', edited by Carol Kendall and Jeffrey J. McDonnell, which first introduced Dr Kendall’s innovative dual isotope plot of a range of typical nitrate sources. The plot allows researchers to quickly identify the probable source of nitrate in environmental samples by analyzing its δ15N and δ18O value and comparing the result to the plot. There are significant applications for this type of data, particularly when it comes to developing solutions to the challenges of pollution in surface water and groundwater, and the plot has developed into the fundamental framework for understanding environmental nitrate sources.
Nitrate pollution from anthropogenic sources poses a serious threat to the health of our environment, because it can cause algal blooms and hypoxia in surface waters and groundwaters, which can destroy entire ecosystems. This may not only lead to obvious ecological damage, but may also have a significant impact on the economies and health of local communities that depend on these ecosystems. However, it is hard to understand the true extent of nitrate pollution because nitrate is an essential nutrient that occurs naturally and supports plant and animal life. Separating naturally-occurring nitrate from nitrate produced by human activity is crucial in recognising problem areas and addressing pollution at its source.
To be able to show a simple plot that identifies where hotspots of nitrogen were, and what the sources are, is a great way to hold people accountable.

Stable isotope analysis enables researchers to identify the likely dominant sources of nitrate, whether from agricultural fertilisers, animal manure, improperly treated sewage and wastewater, or other sources. The dual isotope plot of nitrate sources makes it simple to visualise the likely sources of nitrate in water samples, as the first step towards implementing solutions.
We sat down with Carol to discuss how she developed the now famous dual isotope plot, the impact of her work over the last quarter-century, and the applications of her research to address urgent concerns about environmental pollution.
Developing the plot
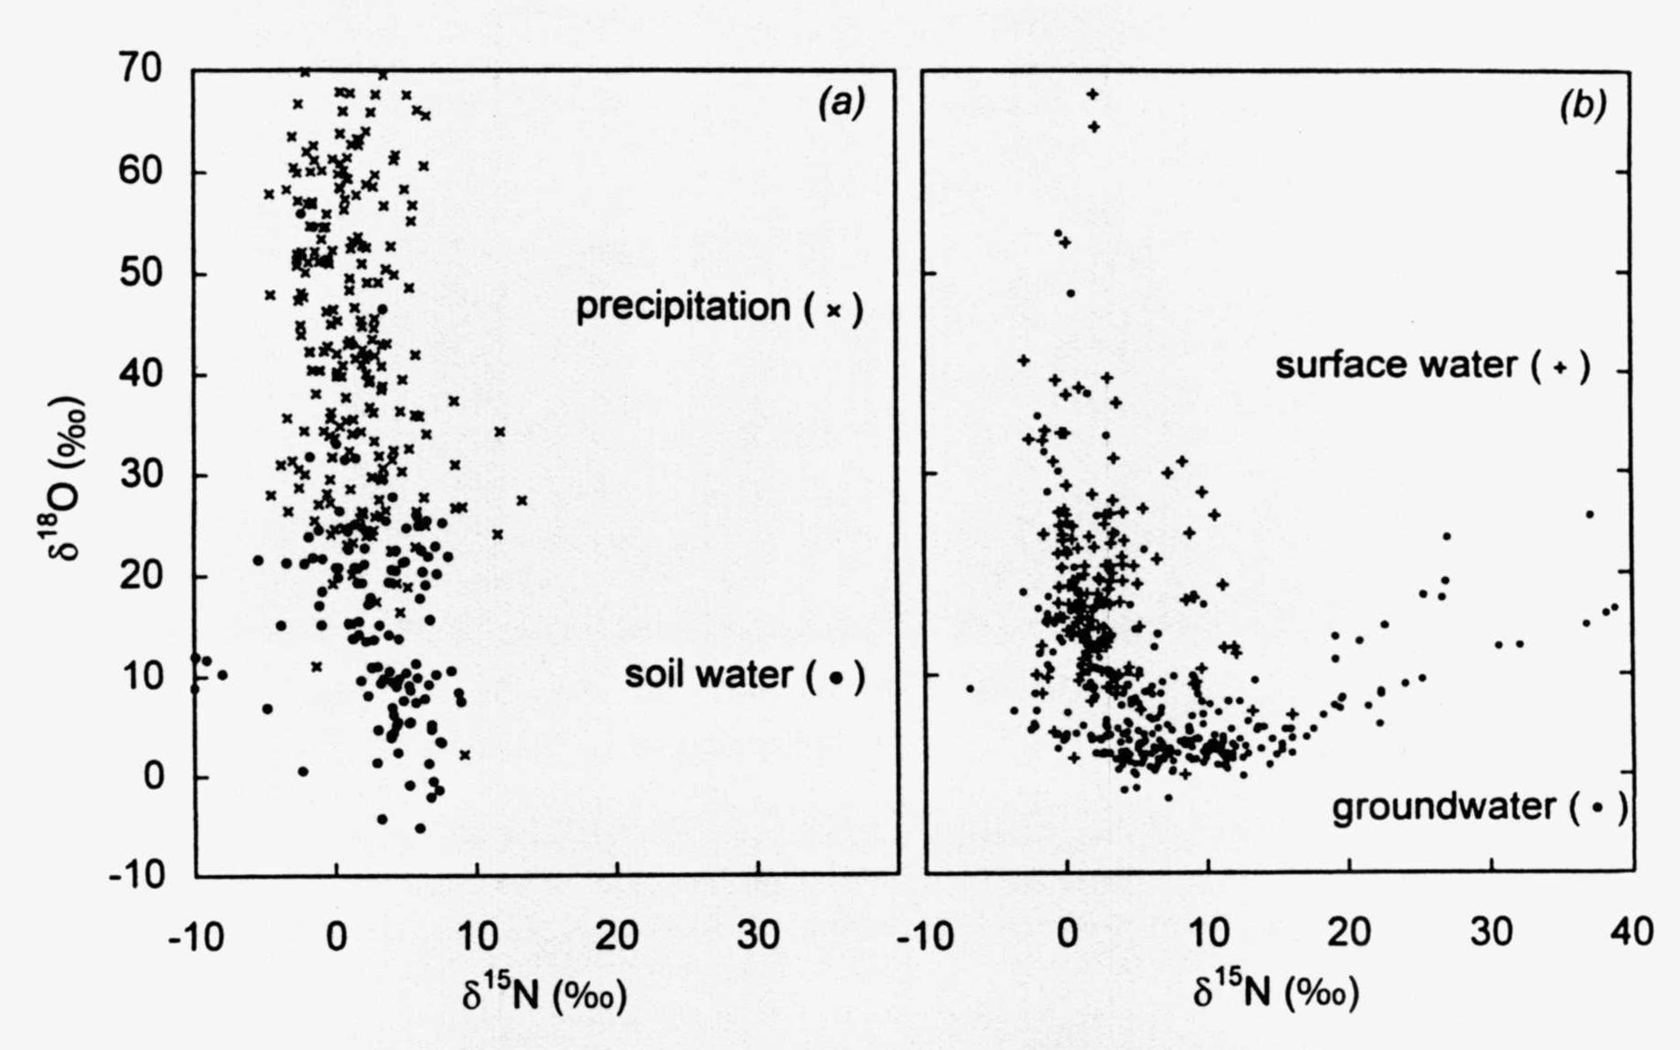
To create the plot, Carol compiled as much published nitrate isotope data as was available in the late 1990s and plotted it all together as shown by figure 16.6 in Isotope Tracers in Catchment Hydrology.
Then, after considering factors such as the possible impact of highly localized data and deciding which data points could be considered outliers, Carol was able to draw boxes that grouped the values together by their source. This led to the plot in figure 16.9, which represented the first attempt to summarize the sources of environmental nitrate.
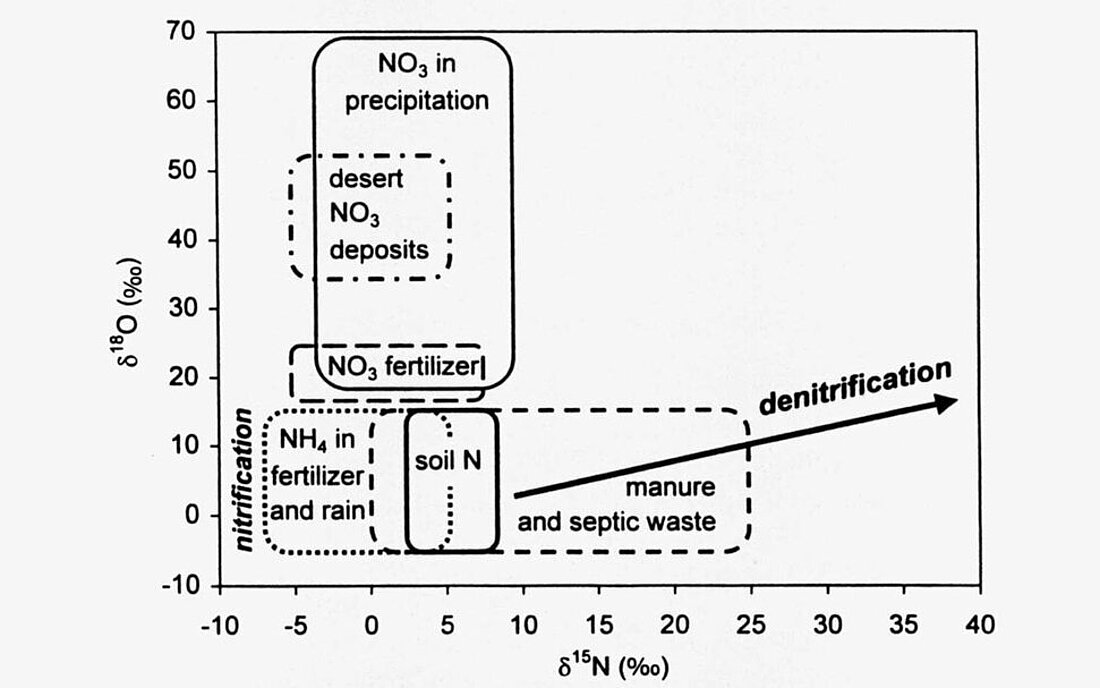
The function of the plot is visually clear - based on the data you provide about 15N and 18O isotope values, it identifies the likely source or sources of the nitrate in a sample. The plot presents a simple summary of possible nitrate sources, although it is important to consider a host of complex natural processes that could affect the results. These include nitrification and denitrification of samples caused by biological processes, the volatilisation of ammonia and the possibility of mixing. The isotopic effect of these processes needs to be understood -but once you arrive at your final isotope values, it is easy to reach a probable conclusion as to their source.
The plot has made understanding the role of isotopes in the environment significantly easier over the last 25 years. Researchers in the US collect a lot of data, and Carol says: “It is easy to piggyback on big monitoring programmes in the United States to get unique sets of samples that somebody else has collected. They’ve been analyzed for water chemistry and there’s detailed hydrologic information. There are also problems that these researchers want answers for - so they can’t have the samples sit there without analyzing them to determine the sources. They can plot their river samples and see what the sources [of nitrogen] are. So in that way, the plot made stable isotope analysis more popular in the US.”
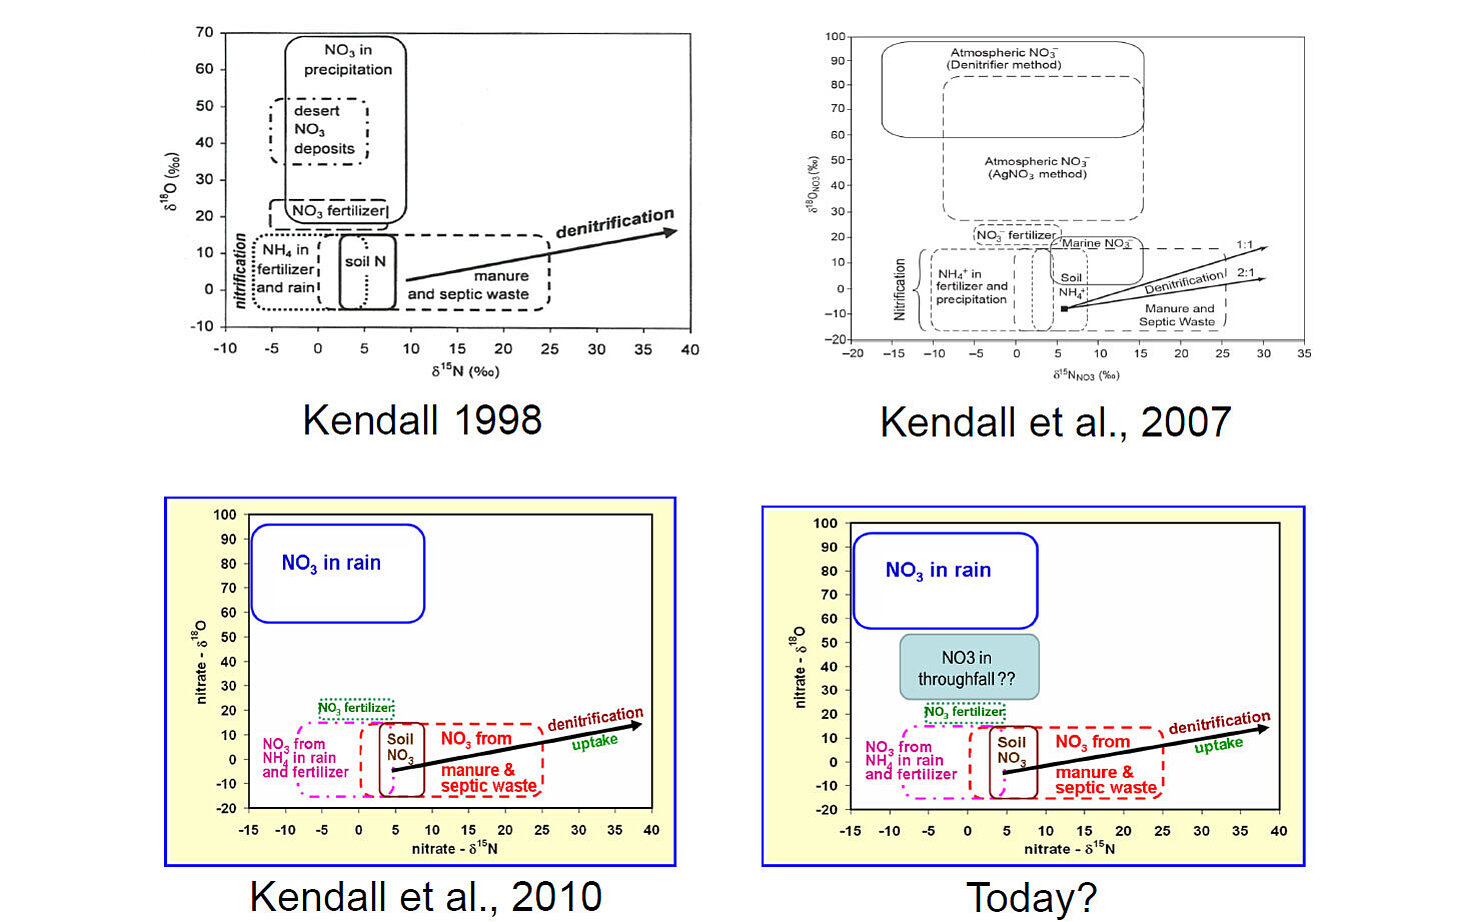
In 25 years, the plot has been revised a number of times, including by Carol herself. In her first formulation, Carol’s data for precipitation samples included dry-deposition samples, and samples collected under tree canopies. The original plot accounts for the large variance in isotope values in these samples, but in the plot Carol uses now, she excludes dry-deposition and canopy-deposition samples.
Applications of stable isotope data
The continuous monitoring of water quality will be vital in global efforts to tackle nitrogen pollution. Stable isotope analysis should be a key part of this, and with wider access to a new method of sample preparation, this is now much easier to achieve than it has ever been. Carol’s dual isotope plot will play a significant role in this effort.
Carol told us that the US is leading the way in this respect, with authorities making good use of the isotope data that are available thanks to routine continuous monitoring. “They’re interested in our data, because it answers their questions. They might need to know whether there's any possibility that the high nitrate content in a sample might be from manure rather than fertiliser, and we can show them the results. For example, in one stretch of the river, it may look like manure is a larger component, but at another point, manure is the lesser component and fertiliser is the bigger source. They can use that to start developing tailored solutions, and the fact that [the US Geological Survey and others] continue to fund such projects over many years shows that they have value.”
Thanks to the ongoing monitoring and data collection programmes in the USA, there are many opportunities for researchers to piggyback on these data and plot stable isotope data, in order to generate more insights into the environmental mechanisms at play. The insights that US agencies are able to gain by collecting longitudinal data could act as a useful example and incentive for governments, researchers and environmental stakeholders around the world to expand their capacity and use of stable isotope analysis.
Another factor that could expedite this uptake is the development of a new method for stable isotope analysis by Drs Mark Altabet and Leonard Wassenaar. Older methods often had significant downsides - they were offered by only a few laboratories around the world because they required complicated sample preparation, and as a result, it could be slow and expensive to obtain results. The new method, which uses titanium (III) chloride, has removed almost all of the barriers to entry and means that data can be collected much more quickly and cost-effectively. We expect to see more labs take up this kind of analysis over the next few years as a direct result of this innovation, and this could mean much greater access to stable isotope data. Using Carol’s plot, this could offer researchers a much more detailed understanding of the causes of pollution in natural waterways.
For Carol, the strength of her plot is the way that it clearly communicates the results of a study. With data visualisation, scientists can make more persuasive arguments, she says. “To be able to show a simple plot that identifies where hotspots of nitrogen were, and what the sources are, is a great way to hold people accountable.” This gives researchers a key tool with which to communicate the problems of nitrate pollution to politicians and decision makers. By presenting the data visually and with the clarity that Carol’s plot affords, environmental researchers can show the anthropogenic sources of nitrate in water samples in a way that is easy for stakeholders to understand. This allows them to emphasise the urgency of the nitrogen problem and empowers decision-makers to take action. This visual clarity is another reason that the dual isotope plot has enjoyed enduring appeal.
After 25 years, Carol’s plot is still being used to make a difference in environmental research, at a time when this is more important than ever.
About Carol
Carol Kendall is a hydrologist, who is known for her research in nutrient tracking in aquatic ecosystems, using combinations of stable isotopes. She spent much of her career with the US Geological Survey, as a research hydrologist and later as a project lead for the National Research Program's Isotope Tracers Project. Undertaking her PhD with the University of Maryland while working full-time at USGS, her thesis focused on isotopes in shallow water systems. Carol has since retired and now spends her time caring for rare species of butterflies.
We'd like to thank Carol for taking the time to speak with us.
Further Reading
Would you like to receive the latest information on our solutions for stable isotope analysis?
Subscribe to our newsletter and be always up-to-date.